What is statistical significance testing?
Significance testing refers to a number of related techniques for making inferences from data within the frequentist or error statistical paradigm. The basic logic is straightforward and can be explained with a story.
Suppose you would like to test whether a patient is allergic to dust mites. Allergies are often tested by means of a “scratch test”: A small scratch is made in a patient’s skin, and a potential allergen is dropped into the scratch. One of the scratches is made with a substance that humans aren’t allergic to, like glycerin.
All the scratches lead to a small amount of irritation of the skin, including the neutral one. However, if the patient is allergic to dust mites, the scratch with the dust mite allergen will become much more irritated than is typical for a mere skin scratch. The skin will turn red and may even swell into a welt. A lack of unusual redness, however, does not mean that the patient does not have an allergy to dust mites. It may mean that the test may have been done incorrect, or that the patient is not sensitive to the concentrations used in the scratch test.
This example has the crucial elements of significance testing logic:
- A hypothesis to be tested (This patient is not allergic to dust mites)
- An observation carrying the evidence (irritation; more irritation means more evidence against the hypothesis)
- An expectation assuming the hypothesis is true (The skin will not get much more irritated than with the neutral glycerin)
- Willingness to reject the hypothesis as untenable if the observation is too inconsistent with the hypothesis (This person has an allergy to dust mites)
When we do a statistical significance test, however, there’s a bit more to it. We generally have model of variability due to sampling or some other random process, which is lacking in the above example. We can take a look at the above
Making it formal
Suppose you are working for a referendum campaign. The referendum is four weeks away, and although people generally support the referendum, in your country, referendums need one-third of registered voters to actually turnout for the vote to be binding. Your campaign is trying to determine whether that threshold is likely to be met.
If turnout is likely to be low, the campaign will consider emphasizing turnout in their advertisements until the vote. You decide to perform a poll of registered voters to see whether or not they “definitely intend to vote”. You’ll feed back the results to the campaign, who will use the results to inform their advertising.
You decide to call 100 registered voters randomly-selected registered voters from a list.You want to know, generally, whether turnout will be low or high. We’ll define “low” and “high” later, as needed. First, we take a look at what we need for a test.
- A hypothesis to be tested (Projected turnout is high enough not to be worried about)
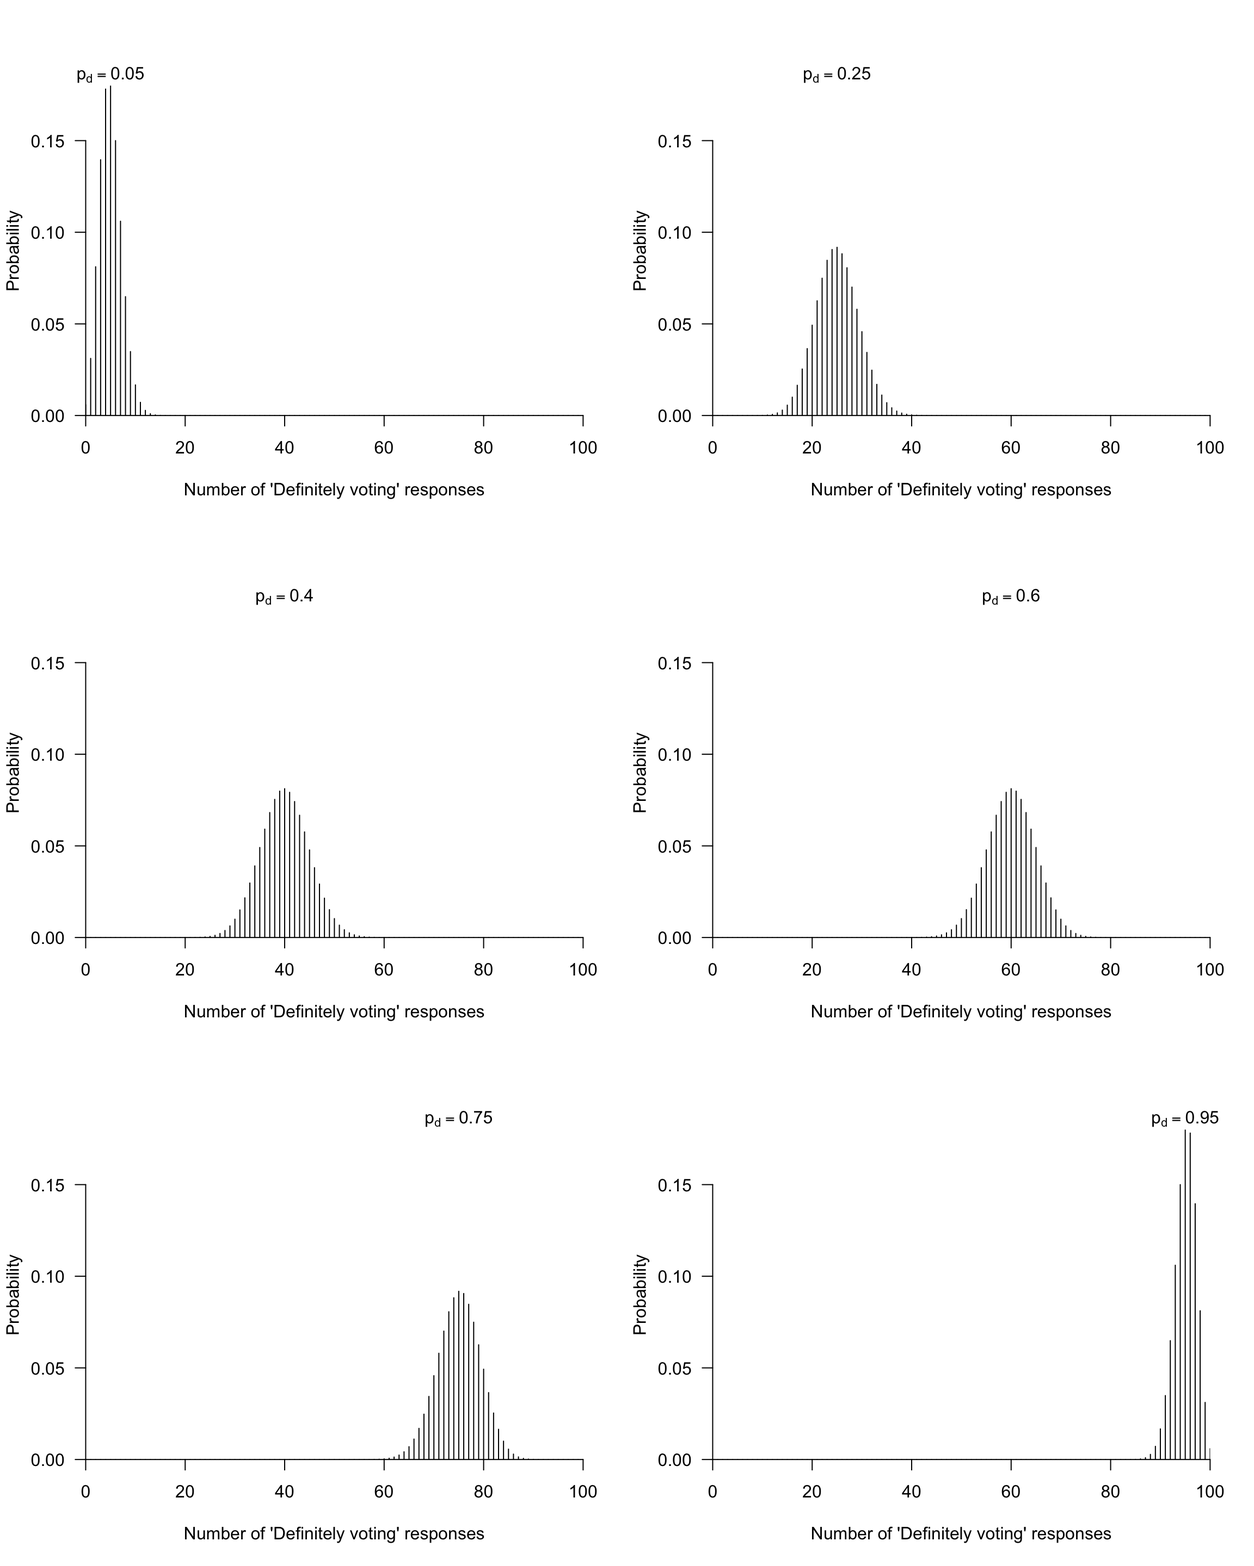
- An observation carrying the evidence (How many “definitely intend to vote” responses did we see in our sample?)
- An expectation assuming the hypothesis is true (We will get many “definitely intend to vote” responses in our sample)
- Willingness to reject the hypothesis as untenable if the observation is too inconsistent with the hypothesis (If many of our respondents do not say that they “definitely intend to vote”, we will be worried that projected turnout is too low)
